
Honoring Passover – A BI tip for the holidays!
Someone at your organization will probably want to perform BI data slicing based on the holidays.
Examples may include: “all sales made during the holiday period”, or “the number of work hours by employees in department X without weekends and holidays”. So how can we filter or slice data related to the holiday period? By using the relevant attributes in the time dimension, of course. The basic assumption is that you already have a time dimension and that it is updated from time to time. In the event that you don’t have anything like this, I recommend using a procedure that automatically builds this dimension: example for Oracle or for SQL Server.
Now, assuming that you have a time dimension that includes data for 10 years ahead, you can insert new columns into it such as “Is_Holiday” and “Holiday_Name”. How is this done? First, you need a data source. A very convenient solution is www.hebcal.com which will generate a CSV for you with all the holidays, from a certain date to a certain date. The purpose of the site is to create a calendar for the Outlook/i-Phone/Google Calendar/site that you use, but the trick is that if you ask it to create a calendar for Outlook 97-2003, the site will offer to provide that calendar to you as a CSV – which will make the problem a lot easier (a little bug: it seems that the holiday names will only appear in English).
The short guide:
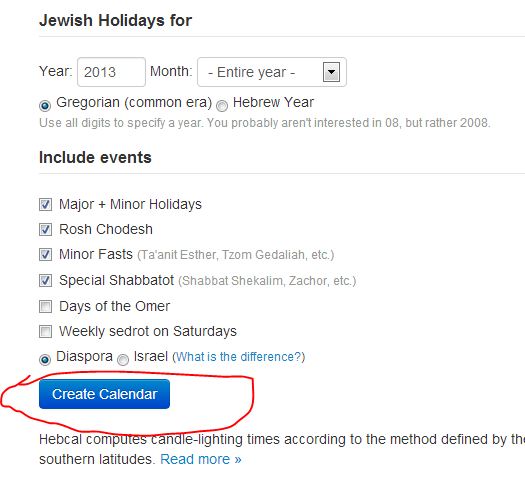
1. Enter the site and click “Customize your calendar”:

2. Customize the definitions of the calendar any way you want to and then choose “Create Calendar”:
3. Click “Download” and then the following screen appears. Now you need to choose the outdated Outlook 2003 version, which will be very helpful to us:
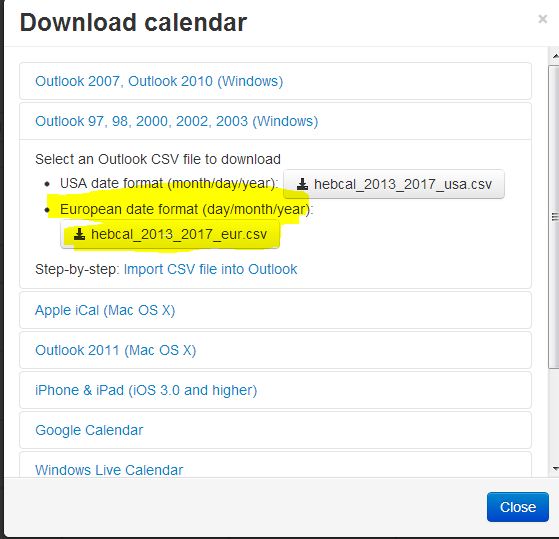
4. Instead of clicking the row in yellow, we’ll right click and then choose “Copy link shortcut” (or another command along those lines, depending on your browser), and then we’ll get an address that looks something like this:
You can play with the parameters as you please. The most important parameter comes at the beginning: the starting year (in the example: 2003). The file will provide data for 5 years ahead. This way you can build your time dimensions for years ahead.
Of course after the CSV is created for you, you will need to decide how to insert it into the time dimension: you can customize the code that creates the time dimension so that it draws the data from the table created from the CSV, or you can build an ETL process that takes the CSV data and updates the current dimension as you choose. It’s up to you and depends on how you work.
After you add the relevant fields to your time dimension, add them as attributes also to the time dimension in the cubes. Now you can slice data based on the holidays.
For further questions or suggestions of sites that perform the action better, I would love to get your comments in the comment box below.
Happy Holidays!